Email marketing is one of the most essential tools in the toolbox of small publishers. Unlike other platforms, with email, you can reach your audience with messages directly in their inbox. And one of the most popular email marketing tools continues to be Mailchimp.
Mailchimp has its pros and cons - but with a generous free plan, a large set of features, and simple WordPress integrations, Mailchimp is one of the first tools that small publishers will try out for email marketing.
After building your list and sending some email campaigns, you will want to start analyzing how these campaigns are performing. Mailchimp has built-in campaign reports that give you a wealth of information, but they are also static and lack the ability to customize to your needs.
In this article, we will show you the key aspects of the Mailchimp Campaign Report and how you can take it to the next level by customizing your own Mailchimp reports in Google Data Studio.
Using Campaign Reports in Mailchimp
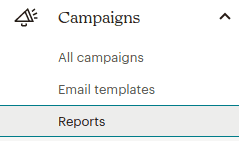
First, let’s look at how you can use Campaign Reports directly in Mailchimp. You can access Campaign Reports from the Mailchimp sidebar on the left by clicking on Campaigns:
And then underneath that by clicking on Reports:
If you have multiple Mailchimp Audiences (Mailchimp lingo for lists) you will then have to pick from the dropdown which Audience you want to filter by.
Finally, you can open up a report for a given campaign by clicking on the View Report button next to the campaign you would like to see:
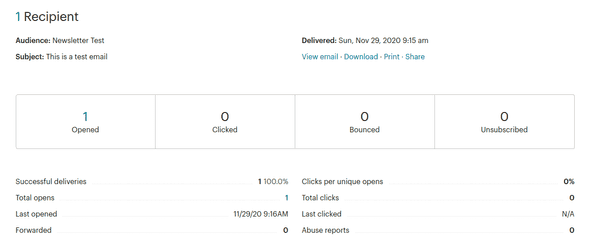
Now that we are in our Mailchimp Campaign Report, let’s focus on the key numbers which are right at the top:
Further down the report, there are other more advanced features that allow you to track campaign performance over time and look at individual link clicks but for the main purpose of understanding the effectiveness of your campaigns we will focus on the most important metrics:
- Opened - the number of people who received the email campaign and actually opened it
- Clicked - the number of people who clicked at least once on the email campaign
- Bounced - the number of emails sent that were not successfully delivered, due to an invalid email address or an autoresponder (e.g. for out of office)
- Unsubscribed - the number of people who unsubscribed by clicking on the “Unsubscribe” button at the bottom of this email campaign
- Recipients - how many people on your list were sent emails as part of this campaign
- Successful Deliveries - the number of your sent emails that actually reached your subscriber’s inbox
With these metrics, you have the key numbers for understanding your campaign performance.
- A high number of bounces tells you that your list quality is not great and you need to either send emails more frequently or better validate email addresses at the time of signup (by using dual opt-in for example)
- A low number of opens means you should work on more engaging titles
- A lot of clicks means you have provided good engaging content
- Unsubscribes, on the other hand, mean your content might not be so relevant for your audience or you might be bombarding your list with too many emails
This gives us some important insights, but let’s see how we can make this Mailchimp Campaign Report even better.
Limitations of Campaign Reports in Mailchimp
First, let’s think about the limitations of these built-in Mailchimp Campaign Reports. One issue is that they are not exactly configured in a way to easily analyze an email campaign’s performance. If we wanted to answer the points above, it would take a lot of cross-checking and mental math to put things into perspective.
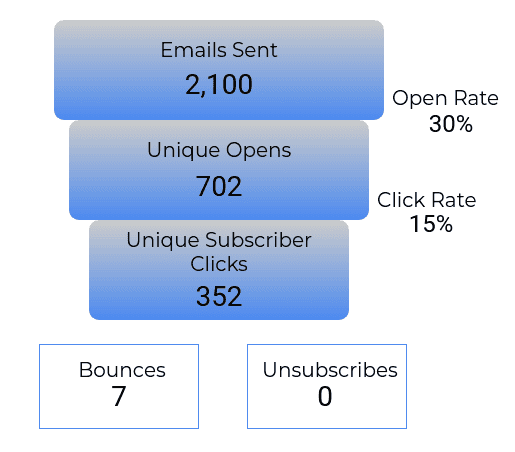
A more intuitive way to think about these numbers is as a funnel, where you start with the number of Emails Sent, then move on to percentages of Opened and Clicked and then finally on to Unsubscribes. Something that looks a bit more like this:
Another issue with Mailchimp’s default Campaign Reports, is that we can only look at these metrics for one campaign at a time. There is no way to look at combined metrics for all of your Email Campaigns. This makes it difficult if not impossible to calculate an average that you can benchmark your campaigns against.
And finally, if you want to compare one campaign’s performance directly against the other, it will cost you at least $299 per month as part of their Premium plan.
Customizing Mailchimp Campaign Reports with Data Studio
Thankfully all of these issues are easily solved by customizing your Mailchimp reports in Google Data Studio. If you’re not familiar with Data Studio, it is a free tool offered by Google that lets you perform advanced data analysis and data visualization.
It has lots of integrations that allow you to access data sources like Mailchimp. We have built one of the most reasonably priced ones out there that you can try for free for 14 days.
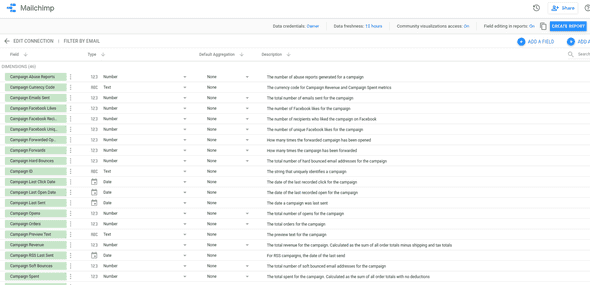
Let’s see how we can recreate and extend our default Mailchimp Campaign Reports in Data Studio. Once you have connected your Mailchimp account, you will see a list of all the Mailchimp data fields that you now have access to.
First, let’s find all of the fields that we originally had in our native Mailchimp Campaign Report. You can find these in the following places:
- Opened -> Campaign Unique Opens
- Clicked -> Campaign Unique Clicks
- Bounced -> Campaign Total Bounces
- Unsubscribed -> Campaign Unsubscribes
- Recipients -> Campaign Emails Sent
- Successful Deliveries -> Campaign Emails Delivered
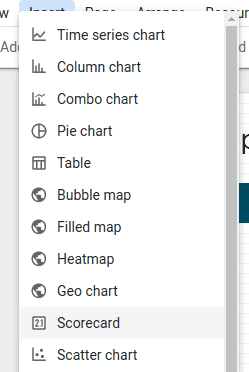
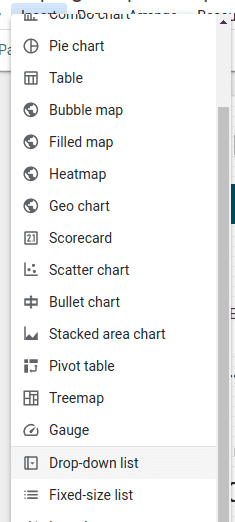
Now let’s recreate the reporting that we have inside Mailchimp, by putting all of these metrics into a Data Studio report. We will use the Data Studio “Scorecard”, which essentially just displays the metric on its own.
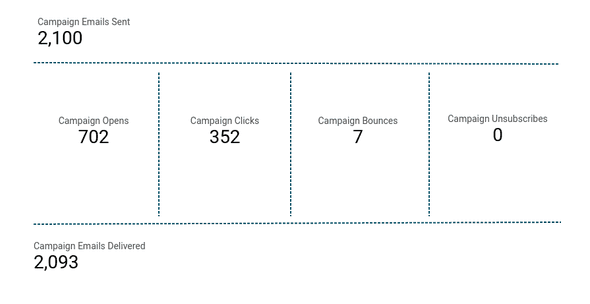
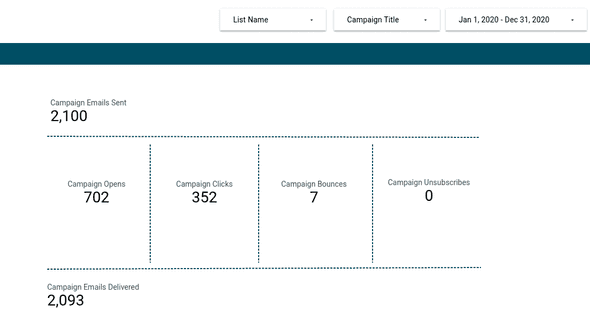
We will add a scorecard for each of the metrics and line them up in a similar way as we had on our Mailchimp Campaign Report:
Right away, we will have an improvement over the native Mailchimp reporting, since these scorecards we’ve added will be reflective of all of our Mailchimp campaigns, not just a single campaign.
Let’s add a couple of dropdown filters so we can filter our data based on our different campaigns and lists:
Just make sure the control field for the dropdown list is set to the field you want to filter on:
Then let’s add a Date Range so we can filter by the date that Campaigns were sent. With all of that done, our Mailchimp Campaign Report will now look like this:
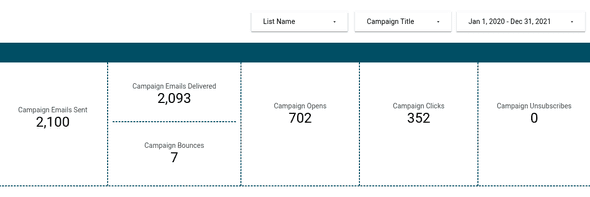
Now we’ve got essentially the key metrics from the default Mailchimp Campaign Report but with the added ability to aggregate and drill down on our data. But let’s not stop there, let’s re-order our data so it looks a bit more intuitive:
Now we’ve got a flow that makes a lot more sense. We are starting from the Emails sent, then the number of deliveries and bounces, then on to opens, and finally clicks and unsubscribes at the end.
To understand this flow even better with a quick glance, let’s add in some percentages, which we can get from the following fields:
- Campaign Email Delivery Rate
- Campaign Total Bounce Rate
- Campaign Unique Open Rate
- Campaign Unique Click Rate
- Campaign Unsubscribe Rate
Finally, let’s see how we can compare these metrics between different campaigns, without needing to upgrade to a $299 Mailchimp plan.
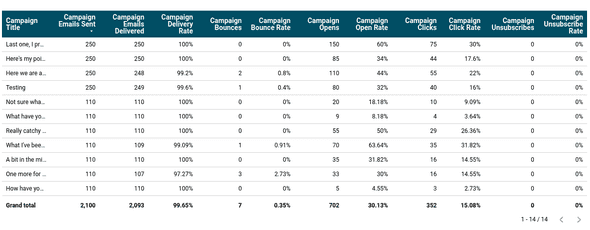
All we need to do is add a table in Data Studio that has the same fields as above, but with one additional field for Campaign Title:
And there you have it, a table that compares all of these different metrics for all of your campaigns in one easy to understand glance;
Wrapping Up
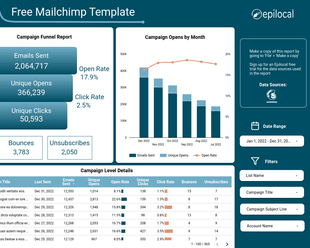
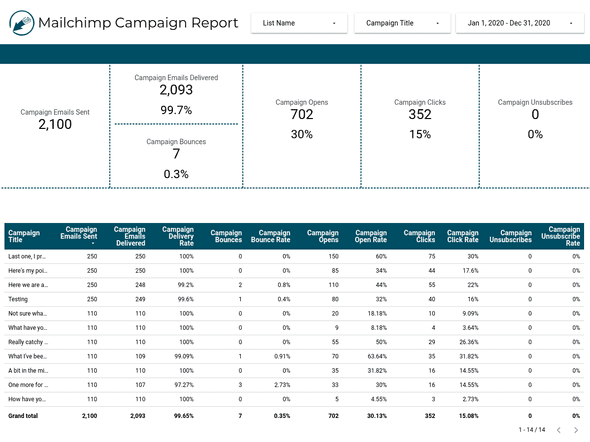
With that, we now have a very simple, yet highly customizable Mailchimp Campaign Report:
You can filter by date or different dimensions at the top, then you have aggregate numbers in the boxes with a detailed breakdown of all the different campaigns in the table below. With this single view, you can quickly see how individual campaigns compare to the overall average.
You can make a copy of the report and use it for free here.
But it doesn’t stop there - hopefully this article gave you lots of ideas of how you can not only create a better Mailchimp Campaign report but how you can really extend your Mailchimp reporting even further using Google Data Studio.
Start your free trial
Connect Mailchimp to Looker Studio in less than 5 minutes
Try free for 14 days






![Connect Plausible Analytics to Looker Studio [Free Template]](/static/02809ee25af3e099ec53e8c6b0bf26db/b6d36/connect-plausible-ds.png)
