Plausible Analytics Looker Studio Connector
Connect and visualize your Plausible Analytics data in Looker Studio with our simple and affordable connector

All the Plausible Analytics fields you need, yet simple to use
Core web metrics
Bounce rate, events, pageviews, unique visitors, visits and visit duration
Page dimensions
Page, entry page and exit page
Traffic source
Referrer, source and UTM parameters
Goals with custom properties
Goals and events complete with custom property level details
High-level demographics
Browser, device and operating system
Geography
Country and region (city level details coming soon)
Build a custom Plausible Analytics report in minutes
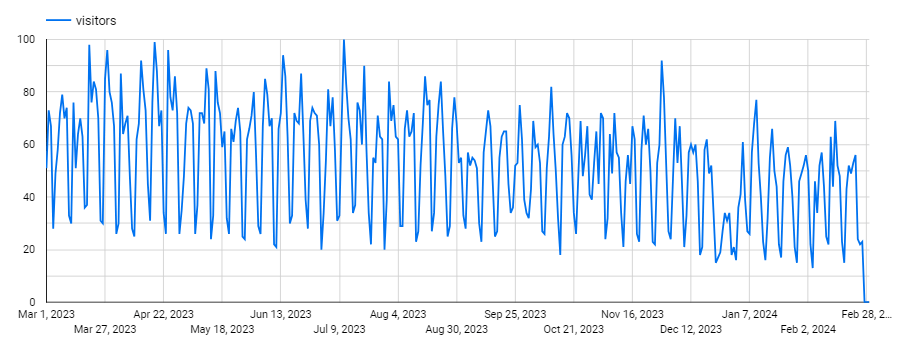
Visualize metrics over time
Summarize key metrics you are tracking over time with Looker Studio timeseries charts. Or combine multiple metrics into the same chart. Want to see visitors, visits and bounce rate next to each other over time? No problem.
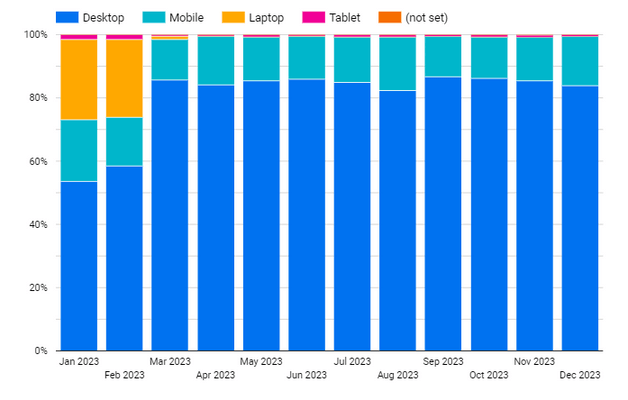
Add breakdown dimensions to your charts
See multiple dimensions and how they impact your metrics at the same time and in the same chart. Want to see how traffic from different devices is changing over time? Check.
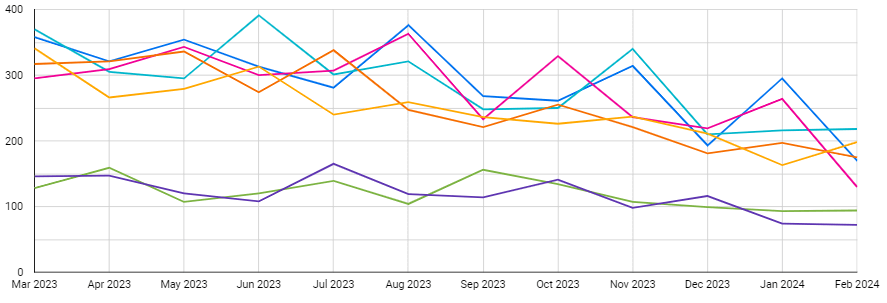
Drill into conversions with custom property details
Create a Looker Studio chart that has all of your different goals broken out and see how they are converting over time. You can even drill down to the custom property level or see events that are not set up as goals.
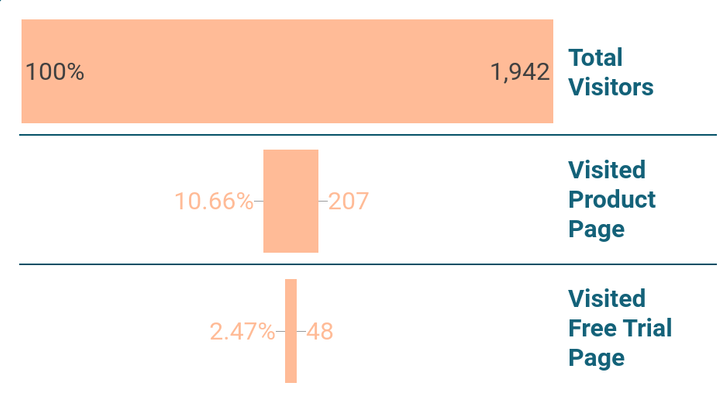
Create custom funnel charts
Looker Studio gives you the flexibility to create complex data visualizations like funnel charts. With a custom funnel chart, you can see how total visitors from a certain source translate into pageviews for different pages or conversion goals.
Easily share your report
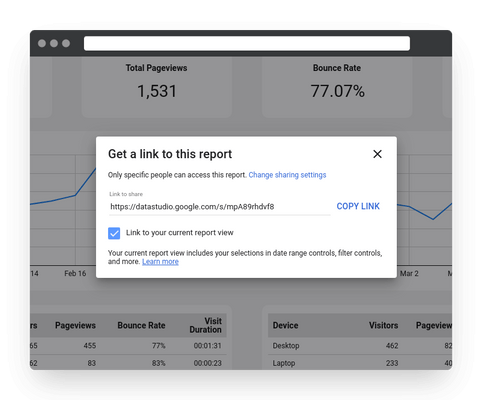
Share your custom Plausible Analytics report with all of the built-in features that come with Looker Studio. Limit access to certain people, share with a link, send email notifications or make everything public.
What people are saying about Epilocal


Stjepan D.
Great tool for Looker Studio reports
I'm using Epliocal's Looker Studio connector for Plausible Analytics. It's easy to use, easy to set up, quick, and efficient. I must give kudos to customer support. It's been great in response time, troubleshooting, and advice. If you're using Plausible Analytics, this connector will help you make great reports in a matter of minutes with their basic template.



Start free trial
Start your risk-free, 14-day free trial. No credit card required.

