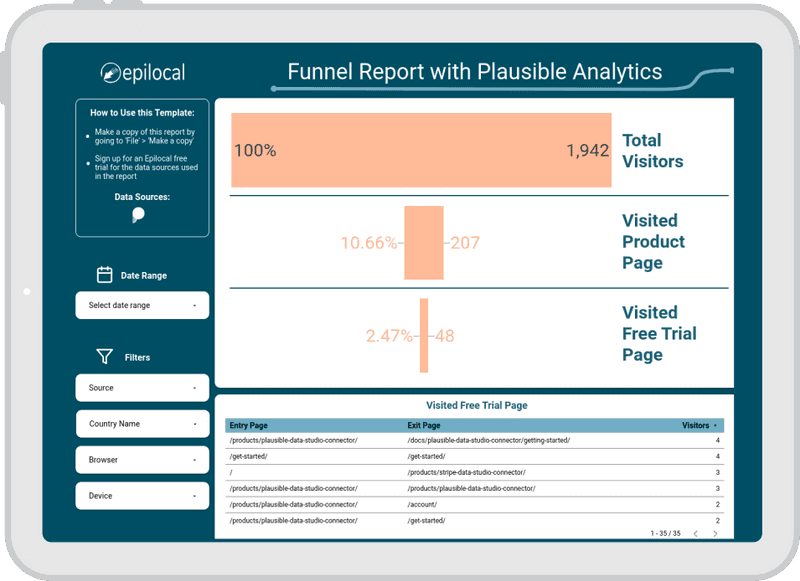
Plausible Analytics Funnel Report Template Overview
With our Plausible Analytics Funnel Report template for Looker Studio (formerly known as Google Data Studio), you can see how visitors are interacting with your website and how many are converting. Using this free 1-page report, you can answer questions like:
- How many visitors are reaching pages I want them to?
- How many visitors are converting?
- Where are visitors that convert coming from?
The funnel report has 3 sections on a single page:
On the left side, you can filter by Device, Source, Country, Browser or Date Range. Then in the upper right, you have the funnel chart which shows in total numbers as well as percentages how visitors are reaching different pages in your website.
Finally, at the bottom, there is a table filtered on the same visitors as the bottom of the funnel, where you can see the Entry Page and Exit page of people who reached this point in your site.
You can find more details in this blog post we wrote about building a funnel report in Looker Studio.
Data Sources
This funnel report template for Looker Studio uses our Plausible Analytics data connector. We have detailed documentation that will help you get started.
How to Use the Plausible Analytics Funnel Report Template for Looker Studio
Clicking the link above will take you directly to Looker Studio where you can explore the Plausible Analytics funnel report template further in Looker Studio. (previously known as Google Data Studio)

