Free Charts for Webflow
How to create free charts for Webflow with no coding required
How to Create Free Charts for Webflow
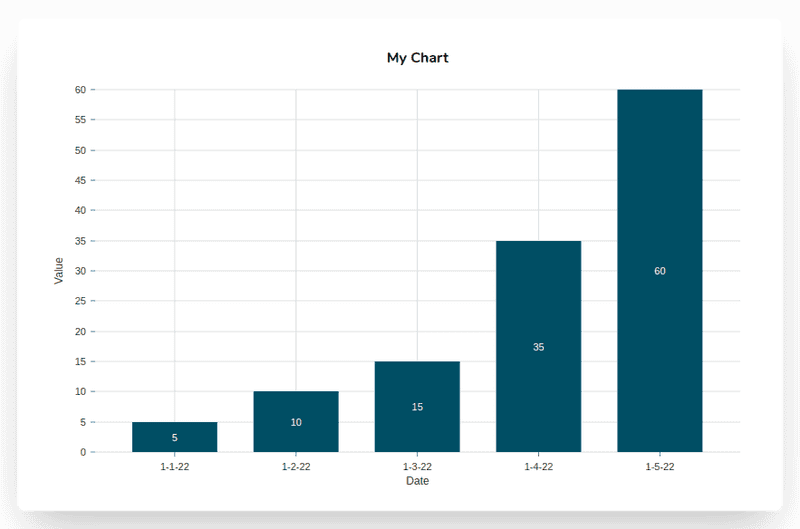
Use our Free Chart Maker to create your Webflow chart. Currently, you have the option of a pie chart, bar chart, or line graph. You must first enter your data in CSV format before customizing your chart by altering its colors, axis information, gridlines, title, and other elements.
Webflow Chart Features
Incorporating mobile friendly, eye-catching charts into the source code of your Webflow posts and pages is easy with our free online tool. Simply create your chart, copy the embed code, and then paste it into your Webflow post.
- Completely free to use
- No need to log in or register
- Pick from bar charts, pie charts or line graphs
- Uses CSV data
- Several color selections and other customizing possibilities
About the Free Chart Generator
Using our free online chart generator, you can create gorgeous graphs and charts that you can post on your website or share on social media. There is no registration necessary, there is no need to explore challenging templates, and there is no steep learning curve for designing because we created an online graph generator that we like to use ourselves - just a straightforward method for creating and sharing charts online, period.

